- one-way repeated measures ANOVA.
- This particular test requires one independent variable and one dependent variable.
- The dependent variable needs to be continuous (interval or ratio) and the independent variable categorical (either nominal or ordinal).
Hypothesis for Repeated Measures ANOVA
H0: states that the means are equal
HA: at least two means are significantly different
If your repeated measures ANOVA is statistically significant, you can run post hoc tests that can highlight exactly where these differences occur.
Logic of the Repeated Measures ANOVA
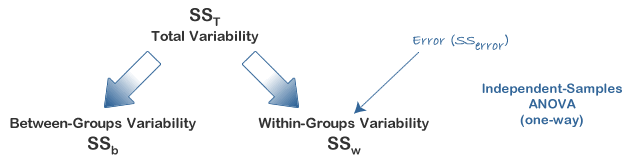
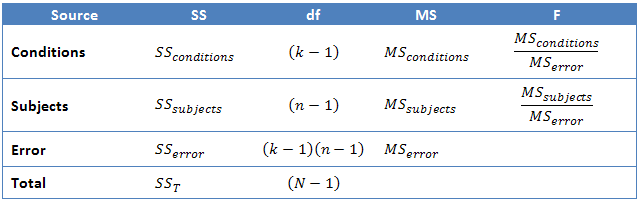
In this design, within-group variability (SSw) is defined as the error variability (SSerror). Following division by the appropriate degrees of freedom, a mean sum of squares for between-groups (MSb) and within-groups (MSw) is determined and an F-statistic is calculated as the ratio of MSb to MSw (or MSerror), as shown below:
A repeated measures ANOVA calculates an F-statistic in a similar way:
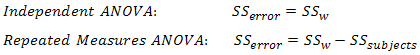
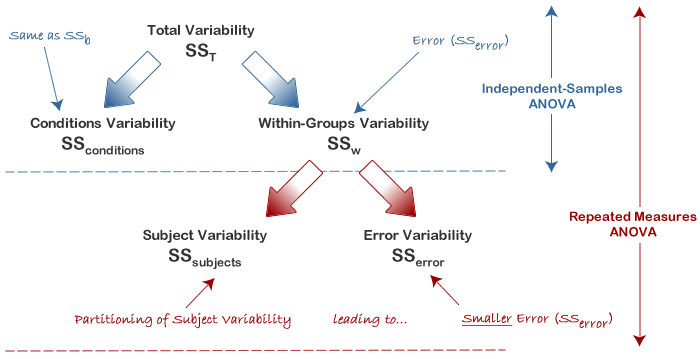
SSconditions: They both represent the sum of squares for the differences between related groups.
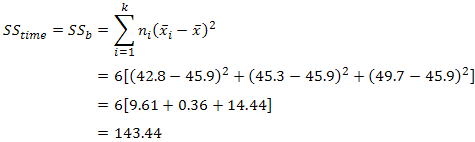
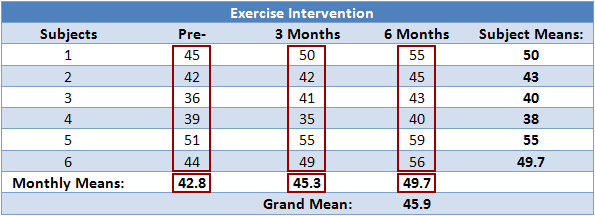
Calculating SStime

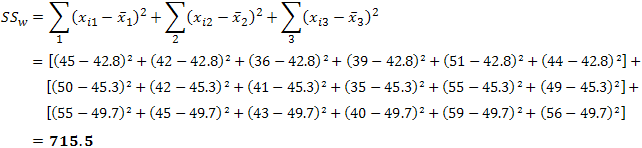
Calculating SSw
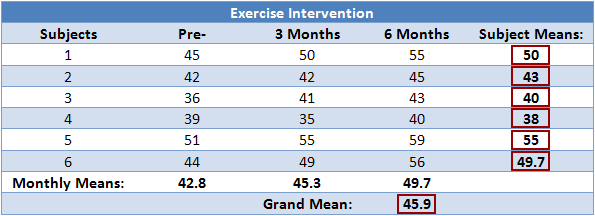
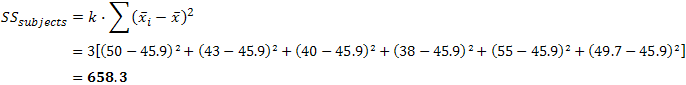
Calculating SSsubjects
Determining MStime, MSerror and the F-statistic
To determine the mean sum of squares for time (MStime) we divide SStime by its associated degrees of freedom (k - 1), where k = number of time points. In our case:
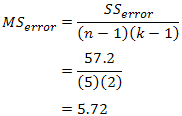
We do the same for the mean sum of squares for error (MSerror), this time dividing by (n - 1)(k - 1) degrees of freedom, where n = number of subjects and k = number of time points. In our case:
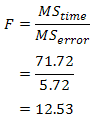
We report the F-statistic from a repeated measures ANOVA as:
F(dftime, dferror) = F-value, p = p-value
which for our example would be:
F(2, 10) = 12.53, p = .002
The six-month exercise-training programme had a statistically significant effect on fitness levels, F(2, 10) = 12.53, p = .002.
Increased Power in a Repeated Measures ANOVA
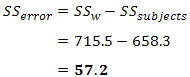
The major advantage with running a repeated measures ANOVA over an independent ANOVA is that the test is generally much more powerful. This particular advantage is achieved by the reduction in MSerror (the denominator of the F-statistic) that comes from the partitioning of variability due to differences between subjects (SSsubjects) from the original error term in an independent ANOVA (SSw): i.e. SSerror = SSw - SSsubjects. We achieved a result of F(2, 10) = 12.53, p = .002
we would have ended up with a result of F(2, 15) = 1.504, p
= .254, for the independent ANOVA. We can clearly see the advantage of
using the same subjects in a repeated measures ANOVA as opposed to
different subjects. For our exercise-training example, the illustration
below shows that after taking away SSsubjects from SSw we are left with an error term (SSerror) that is only 8% as large as the independent ANOVA error term.
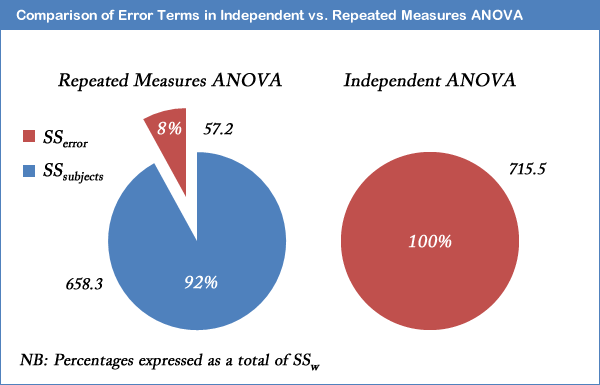
This does not lead to an automatic increase in the F-statistic as there are a greater number of degrees of freedom for SSw than SSerror. However, it is usual for SSsubjects to account for such a large percentage of the within-groups variability that the reduction in the error term is large enough to more than compensate for the loss in the degrees of freedom (as used in selecting an F-distribution).
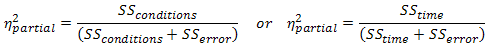
Effect Size for Repeated Measures ANOVA
It is becoming more common to report effect sizes in journals and reports. Partial eta-squared is where the the SSsubjects has been removed from the denominator (and is what is produced by SPSS):

沒有留言:
張貼留言